 Dipole moment of molecules is an interesting physical quantity that can be directly measured in experiments and easily calculated by means of Density Functional Theory. Moreover the size of dipole moment is related to many other properties as for instance light emission in polar liquid, packing of molecules in solid phase. With NWChem it can be easily calculated by adding it to the task list
....
property
 dipole
end
task dft property
.......
In the output you will find something like:
        -------------
          Dipole Moment
          -------------

 Center of charge (in au) is the expansion point
         X =       9.6229939 Y =      12.3717068 Z =       2.0519790

   Dipole moment        2.0829106612 A.U.
             DMX        0.7655683799 DMXEFC        0.0000000000
             DMY        1.8873116476 DMYEFC        0.0000000000
             DMZ       -0.4364362762 DMZEFC        0.0000000000
   -EFC- dipole         0.0000000000 A.U.
   Total dipole         2.0829106612 A.U.

   Dipole moment        5.2942708332 Debye(s)
             DMX        1.9458954336 DMXEFC        0.0000000000
             DMY        4.7971039733 DMYEFC        0.0000000000
             DMZ       -1.1093187485 DMZEFC        0.0000000000
   -EFC- dipole         0.0000000000 DEBYE(S)
In order to plot it you can create simple XSF file with the atomic positions that you can get from the NWChem output (in Angstrom units):
ATOMS
 S                     8.70222693     8.48808492     9.64400356
 S                     2.90858483     6.61818940    -8.14847370
 F                     4.68286375     2.53635798     1.64040323
 F                     2.94564931     4.02992095     2.04927221
 O                     5.16391054     4.64660936     2.56066772
 .....
 X                      5.09226906     6.54682528     1.08586052  0.7655683799  1.8873116476  -0.4364362762
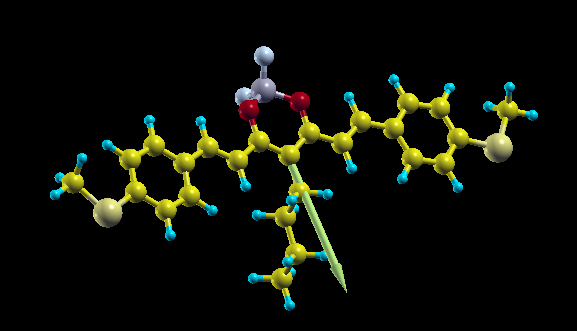
and add at the end a fictitious atom X in the position (in Angstrom) of center of charge plus the dipole vector you get from NWChem. Now you open it with Xcryden doing xcryden --xsf file.xsf , then you go to the menu Display->Forces to show the dipole vector and you can rescale its length from the menu Modify->Force Settings to something around 3, and get a nice plot like the one on top of this article.
Good day,
my nwchem writes in its output file:
1) the dipole moment as shown in the post
2) the dipole moment AT THE END OF THE OUTPUT file WITH NO UNITS but this number is slightly different from the number written in the item above
What is the last dipole (i.e. that in item #2)?
thanks
No idea 🙁