Next: Pair Correlation Functions
Up: Preliminary results on high
Previous: Preliminary results on high
Contents
In order to check the quality of our trial-function we compared the energy and the variance on different configurations with the ones obtained using other functional form for the trial wave-function (7,37).
In the table 6.1 the energy and the variance for a BCC lattice with  hydrogen is reported. As one can see our wave function gives a very good energy. The variance is not so low and this is probably due to the lack of back-flow correlation or to the energy optimization.
Table 6.1:
Total energies in variational ( ) and
diffusion (
) and
diffusion ( ) Monte Carlo calculations for 16 hydrogen atoms in a BCC lattice
at Rs=1.31 and T=0 (i.e. frozen ion positions). The energies are in Hartree for atom.
) Monte Carlo calculations for 16 hydrogen atoms in a BCC lattice
at Rs=1.31 and T=0 (i.e. frozen ion positions). The energies are in Hartree for atom.

|
|

|
|

|
-0.4742(2) |
0.0764(2) |
-0.4857(1) |

|
-0.4857(2) |
0.0274(2) |
-0.4900(1) |

|
-0.4870(10) |
|
-0.4890(5) |

|
-0.4871(5) |
0.0700(1) |
-0.49019(5) |
|
-0.4846(2) |
0.067(1) |
-0.4880(1) |
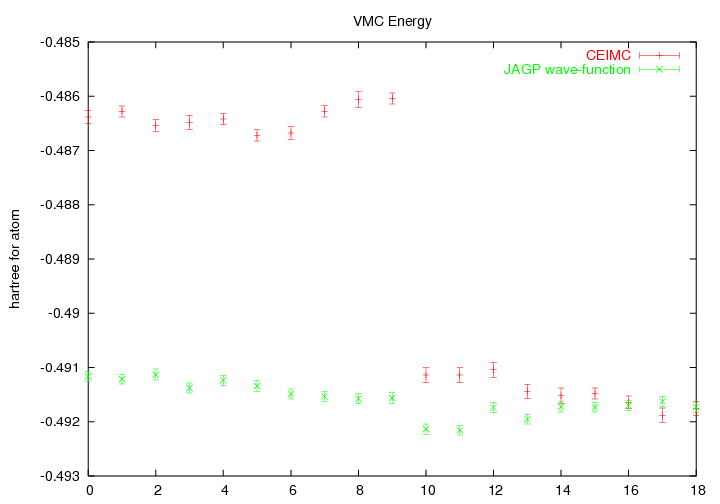
Moreover we compare the energies and variances obtained on different configurations generated with the CEICM method (8). In the figure 6.1 the first ten configurations are obtained at  . Then the system is cooled to
  and it starts to clusterize. If we compare the wave-function of Holzmann et al. (8) with the JAGP wave-function we can see that the latter one gives an accurate description of both the liquid and the cluster phase. This is due to the resonating nature of the JAGP trial-function that allows to describe the liquid phase through resonating bonds among different atoms.
Figure 6.1:
Energy per atom of 16 hydrogen atoms at Rs=1.31 calculated on configurations obtained by CEIMC with the method (8). The first 10 configurations are in the atomic liquid phase at 2000k while in the last ten the system is forming clusters at T=500.
|
|
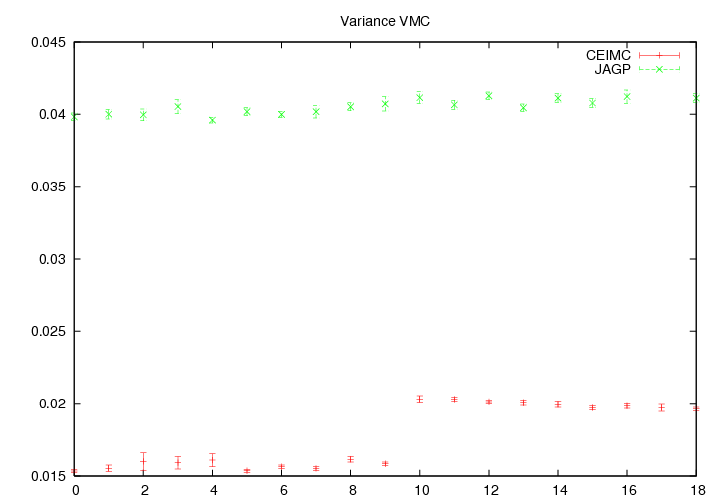
Figure 6.2:
Variance per atom of 16 hydrogen atoms at Rs=1.31 calculated on configuration obtained by CEIMC with the method (8). The first 10 configurations are in the atomic liquid phase at 2000k while in the last ten the system is forming clusters at T=500.
|
|
Then we compared the pressure obtained by using the GLQ technique, obtained after equilibration at given temperature and density, with both Gas-Gun experimental results 6.1 and numerical simulations done with CEICM method (7).
In the table 6.2 we report the pressures calculated for different densities and temperatures. The pressure was obtained as explained in section 4.3.
As it is shown the combination of GLQ with the JAGP wave-function provides a good agreement with the experimental values already with this small size.
6.2.
Table:
Pressure at different temperatures and densities. We report also the pressure obtained with Gasgun experiment (5), with Silvera-Goldman empirical potential model (6) and CEICM method (7) at  point. The pressure are in GPa.

|
T |
Gasgun |
S-G |
CEICM-VMC |
CEICM-DMC |
GLE-VMC |

|

|

|

|

|

|

|

|

|

|
|

|

|

|

|

|
- |

|
- |

|

|
Next: Pair Correlation Functions
Up: Preliminary results on high
Previous: Preliminary results on high
Contents
Claudio Attaccalite
2005-11-07